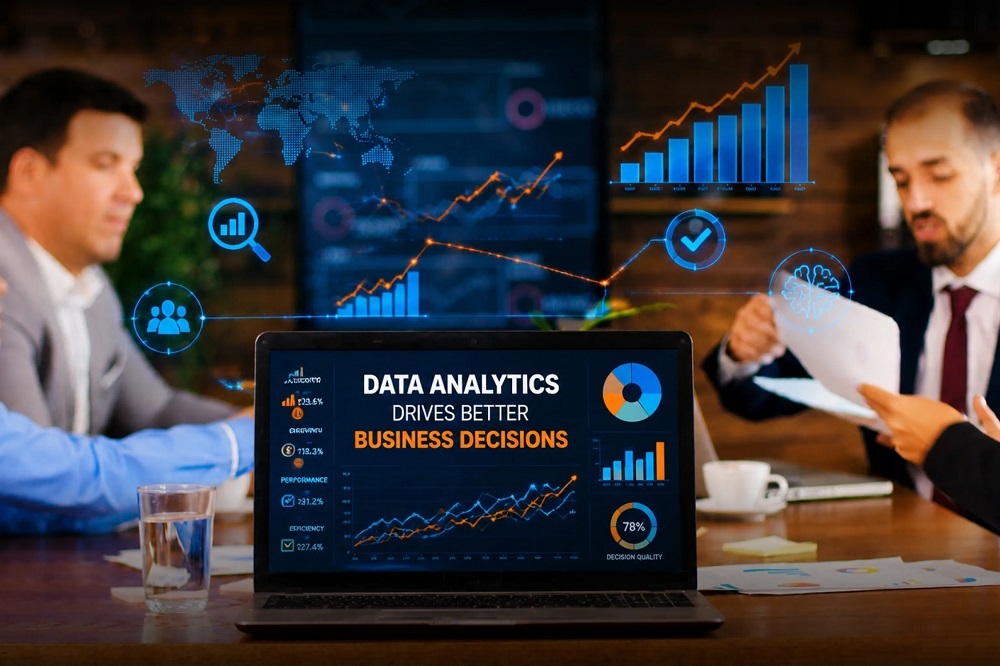

Every commercial enterprise generates a continuous stream of digital signals. Every completed checkout, customer service transcript, warehouse scan, click path, and supplier invoice creates a record of organizational behavior. For decades, business leaders relied primarily on executive instinct, historical precedent, and subjective consensus to set strategic directions. While seasoned intuition still holds value, modern competitive environments demand that organizational choices rest on verifiable, objective data.
Business analytics transforms raw operational data into actionable clarity. It enables leaders to minimize uncertainty, optimize resource allocation, identify latent market demands, and stress-test assumptions before committing substantial capital. By embedding analytical rigor into daily operations, companies shift from reactive firefighting to proactive, strategic execution.
The Four Tiers of Business Analytics
To build an effective analytical capability, organizations must understand the four distinct stages of data maturity. Each tier builds upon the previous one, delivering progressively greater strategic value and operational leverage.
-
Descriptive Analytics (What happened?): This foundational stage examines historical records to summarize past performance. It relies on standard reporting mechanisms, scorecards, and dashboards that track metrics like monthly recurring revenue, customer churn, churn rate, and unit manufacturing costs. Descriptive analytics provides the baseline context required for all subsequent evaluation.
-
Diagnostic Analytics (Why did it happen?): Once a trend or anomaly is spotted in historical reports, diagnostic analytics investigates root causes. By leveraging drill-down analysis, data discovery techniques, and correlation modeling, analysts can isolate the variables behind unexpected performance shifts, such as determining why sales plummeted in a specific geographical territory despite elevated marketing expenditures.
-
Predictive Analytics (What is likely to happen?): Moving beyond backward-looking analysis, predictive modeling uses historical trends, machine learning algorithms, and statistical regression to forecast future outcomes. Companies use predictive scoring to calculate customer lifetime value, estimate seasonal inventory demand, and evaluate customer default risks with high mathematical probability.
-
Prescriptive Analytics (What action should we take?): The most advanced tier evaluates multiple potential future scenarios and recommends the optimal course of action. Utilizing complex optimization algorithms, simulation engines, and heuristics, prescriptive analytics guides decisions on dynamic product pricing, automated supply routing, and portfolio capital distribution.
Core Business Domains Transformed by Data Analytics
Applying analytical modeling across functional business units yields immediate, measurable improvements in financial and operational performance.
Customer Acquisition and Retention
Marketing campaigns historically relied on broad demographic segmentation and educated guesses. Analytics allows growth teams to map the entire customer lifecycle with precision:
-
Attribution Modeling: Multi-touch attribution models measure the exact influence of each marketing channel, helping teams reallocate advertising capital away from underperforming platforms toward high-conversion touchpoints.
-
Churn Prevention: Predictive classification algorithms identify early warning behaviors—such as declining login frequency or support ticket escalations—allowing retention teams to intervene with targeted promotions before a customer cancels their subscription.
-
Hyper-Personalized Merchandising: Recommendation systems analyze purchasing history, browsing sessions, and affinity scoring to present personalized product bundles, significantly increasing average order value.
Supply Chain and Inventory Optimization
Supply chains are vulnerable to global disruptions, sudden raw material shortages, and shifting transport costs. Analytics introduces resilience into logistics networks:
-
Demand Forecasting: Algorithmic forecasting models evaluate seasonal fluctuations, promotional calendars, macroeconomic indicators, and local weather patterns to prevent costly overstocking or stockouts.
-
Route and Fleet Logistics: Network optimization models compute optimal transportation routes in real time, cutting fuel consumption, reducing fleet maintenance overhead, and improving on-time delivery percentages.
-
Supplier Risk Scoring: Dynamic evaluation frameworks assess supplier performance data, lead time variances, and financial stability to pinpoint vulnerabilities before they trigger production shutdowns.
Financial Planning and Capital Allocation
Traditional corporate finance often operates on rigid annual budgeting cycles that struggle to adapt to rapid market shifts. Analytical finance introduces operational agility:
-
Rolling Financial Projections: Dynamic financial models update cash flow forecasts continuously as transaction data streams in, replacing static quarterly reviews with real-time liquidity oversight.
-
Scenario Planning: Monte Carlo simulations run thousands of hypothetical market conditions, helping chief financial officers stress-test balance sheets against fluctuating interest rates, currency swings, and supply shocks.
-
Customer Profitability Analysis: Activity-based costing models reveal which customer accounts actually generate net positive returns after factoring in support costs, custom onboarding, and discounting.
Overcoming Common Data Pitfalls and Cognitive Biases
Access to massive volumes of data does not automatically guarantee superior decision-making. Organizations often fall victim to structural and cognitive traps that derail analytical initiatives.
-
Confusing Correlation with Causation: Just because two data trends move in tandem does not mean one drives the other. Launching strategic initiatives based on spurious correlations leads to wasted capital. Rigorous hypothesis testing, control groups, and A/B experimentation are essential to verify true causal relationships.
-
Falling for Vanity Metrics: Total page views, registered accounts, and social impressions often inflate reporting dashboards without reflecting genuine fiscal health. Decision-makers must focus on actionable metrics that correlate directly with unit economics, customer retention, and net profit margins.
-
Siloed Data Architecture: When sales, marketing, operations, and finance teams operate on disparate, disconnected software stacks, data fragments into conflicting versions of the truth. Unifying datasets into centralized cloud warehouses ensures leadership evaluates performance from a single, verified baseline.
-
Confirmation Bias in Model Design: Analysts sometimes design queries and models to confirm leadership’s preexisting hypotheses. Establishing independent analytical reviews and blind testing protocols preserves analytical objectivity.
Building a Data-Driven Culture Across the Enterprise
Advanced analytical software yields minimal returns if operational managers refuse to use it. Establishing an evidence-based workplace requires intentional organizational design:
-
Democratizing Data Access: Transition away from centralized bottlenecks where data science teams manually build simple ad-hoc reports. Deploy intuitive, self-service business intelligence platforms that allow front-line managers to run queries and generate visualizations independently.
-
Investing in Data Literacy: Train non-technical department leaders on foundational statistical concepts, such as sampling biases, confidence intervals, and regression modeling. An organization only becomes data-driven when its managers know how to ask the right questions of their data.
-
Establishing Rigorous Data Governance: Data hygiene is non-negotiable. Establishing strict protocols for data collection, categorization, deduplication, and privacy compliance ensures analytical models ingest high-integrity inputs.
Practical Framework for Implementing Analytical Decision-Making
To systematically apply analytics to complex business challenges, organizations should follow a structured five-step workflow:
-
Define the Business Problem: Formulate an exact, measurable commercial question rather than a broad topic. For example, focus on determining why regional customer acquisition costs increased fifteen percent in the second quarter.
-
Collect and Clean Relevant Data: Extract historical and real-time records from relevant sources, eliminating duplicate entries, missing values, and irrelevant outliers.
-
Run Exploratory and Predictive Models: Apply appropriate statistical modeling techniques, comparing outcomes against historical control groups and baseline benchmarks.
-
Interpret Insights and Formulate Strategy: Translate technical outputs into concrete, commercial action steps with clearly assigned stakeholder responsibilities.
-
Execute, Monitor, and Iterate: Roll out the strategic adjustment in controlled phases, monitoring real-time performance indicators to refine the model continuously.
Frequently Asked Questions
How can small businesses with limited budgets leverage analytics without investing in enterprise software?
Small businesses can extract substantial value by utilizing affordable, accessible tools like spreadsheet regression add-ons, open-source dashboarding applications, and native analytics built directly into their point-of-sale or ecommerce platforms. Focus first on clean data capture, simple customer cohort tracking, and basic unit economics before considering specialized enterprise data infrastructure.
What is the difference between standard business intelligence and advanced business analytics?
Business intelligence focuses on reporting, querying, and visual dashboards that explain historical and current operational states. Advanced business analytics incorporates sophisticated statistical modeling, predictive algorithms, machine learning, and automated optimization to forecast future conditions and dictate proactive strategic decisions.
How does qualitative customer feedback fit into an analytics-driven decision framework?
Qualitative data, including customer interviews, survey responses, and user experience recordings, provides the context that quantitative metrics often lack. While quantitative analytics reveals what behavior is happening at scale, qualitative analysis illuminates the underlying motivations, emotional barriers, and user perspectives behind those numbers.
What data privacy regulations must organizations navigate when analyzing consumer datasets?
Organizations must comply with regional frameworks such as the California Consumer Privacy Act, the General Data Protection Regulation in Europe, and emerging state-level privacy mandates. These laws require explicit consent, data minimization, strict security safeguards, and clear opt-out mechanisms for consumer tracking and automated profiling.
How can leadership prevent analysis paralysis when facing tight project deadlines?
Leaders can mitigate analysis paralysis by adopting a threshold approach, such as making decisions when roughly seventy percent of the desired information is available rather than waiting for absolute certainty. Defining clear project scope limits, focusing strictly on top-priority variables, and utilizing time-boxed decision sprints prevents endless modeling cycles.
What key performance indicators demonstrate that a company data culture is maturing?
A maturing data culture is marked by an increase in self-service query adoption among non-technical staff, shorter project cycles from data discovery to production deployment, a declining volume of conflicting inter-departmental metric reports, and consistent inclusion of statistical confidence intervals in executive proposals.
How do dark data and uncollected operational logs impact decision accuracy?
Dark data refers to unstructured, unindexed information that companies collect and store but fail to utilize, such as archived customer support tickets, network logs, and legacy email records. Ignoring these hidden data pools creates blind spots in analytical models, depriving decision-makers of valuable operational context and user feedback.